HFSC Traffic Shaping Statistics (Manchester - 19.06.2007)
Author: Rafal Rajs (ElessaR) (email: elessar1@poczta.wp.pl)
Introduction
Hello all,
I'd like to present you two munin scripts I have written recently, which graph the statistics of the HFSC Traffic Shaping described in my article.
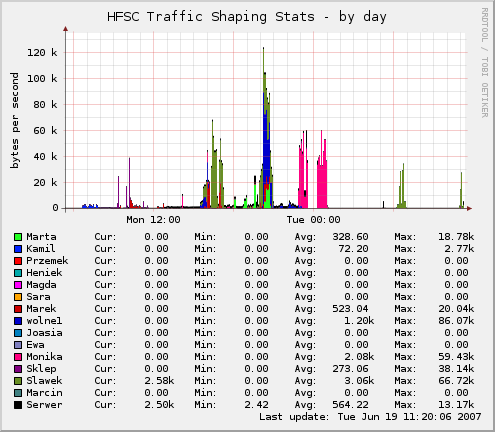
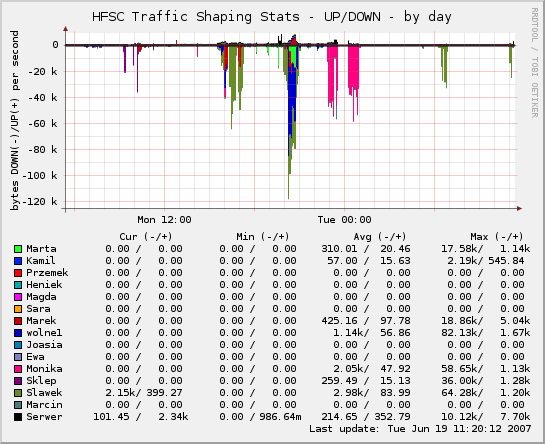
Below, you can find the example graphs.
1. General statistics graph of used net bandwidth per user.
2. Download and Upload statistics graph of used net bandwidth per user.
Do you like the graphs?
If YES, please continue reading. I will describe how the munin scripts work, how to install and use them.
How does this work?
In order to create graphs I have used the excellent Munin package. It contains many very useful plugins, however precise network usage graphs per user need to be written by ourselves.
I tailored the scripts to my HFSC Traffic Shaping solution. Two scripts were created:
1. General statistics graph of used net bandwidth per user - hfsc
2. Download and Upload statistics graph of used net bandwidth per user - hfsc_sep
The scripts use the following 'tc -s class show' command for checking the amount of bytes sent through a user queue:
solaris#/sbin/tc -s class show dev imq0
[...]
class hfsc 1:101 parent 1:11 leaf 221: sc m1 0bit d 0us m2 15000bit ul m1 0bit d 0us m2 980000bit
  Sent 32518346 bytes 26218 pkt (dropped 0, overlimits 0 requeues 0)
  rate 0bit 0pps backlog 0b 0p requeues 0
  period 17049 work 32518346 bytes rtwork 2342089 bytes level 0
'Sent 32518346' value is added to 'Sent' values from other user queues. Currently, we have 4 user queues (2 download and 2 upload queues). This definition was taken from the hfsc Shaping Traffic script.
N_CLASS_D_1=70
N_CLASS_D_2=100
N_CLASS_U_1=130
N_CLASS_U_2=160
Adding all 'Sent' values from all user queues will give us the bandwidth the user took. Adding all download and upload separately will give us the second graph, where we are able to see download and upload statistics independently.
We are required only to count bytes. The rest of the job (function to time, i.e. bps) is done by the Munin package.
How to install
The installation of the scripts is really easy.
1. You neet to put the scripts files (hfsc, hfsc_sep) to the munin plugins folder ( for example "/etc/munin/plugins")
2. You need to add hfsc entry to the munin-node config file:
[hfsc*]
user root
3. You need to set the temporary files for the scripts. Default values are the following:
hfsc: SH_TMP="/etc/scripts/tmp.txt"
hfsc_sep: SH_TMP="/etc/scripts/tmp1.txt"
I suggest using folders where only root can write to avoid possible security problems.
4. You need to add the USERNAMES variable to the GLOBAL config file.
In the GLOBAL config, only USER_IP variable was defined as follows:
USER_IP[1]="10.1.1.50"
USER_IP[2]="10.1.1.60"
USER_IP[3]=$IP_ZEW  # this is the address of the server external network interface
You need to add the USERNAMES variable to receive a nice legend in the Munin graph. For example:
USERNAMES[1]="John"
USERNAMES[2]="Dave"
USERNAMES[3]="Server"
End
That's all. If you configured the Munin package properly, you should see HFSC graphs under the NETWORK section.
I hope you enjoyed the article. If you have any comments, send them to me, please.
best regards
Rafal Rajs